Extract all the juice from data
Very often, clear trends and phenomena can only be detected when combining observations. This is the reason why the EU Pollinator Hub aims to centralise and harmonise the largest possible amount of field data related to pollinators. Analysing and visualising the shared data will help understand the status of pollinators all over Europe.
In addition, Data Providers sharing their data in the EU Pollinator Hub profit from the arsenal of data visualisation and reporting possibilities integrated into the Hub. Do you have specific visualisations and reporting needs outside of the available templates?
Just contact us, and we will see how to help!

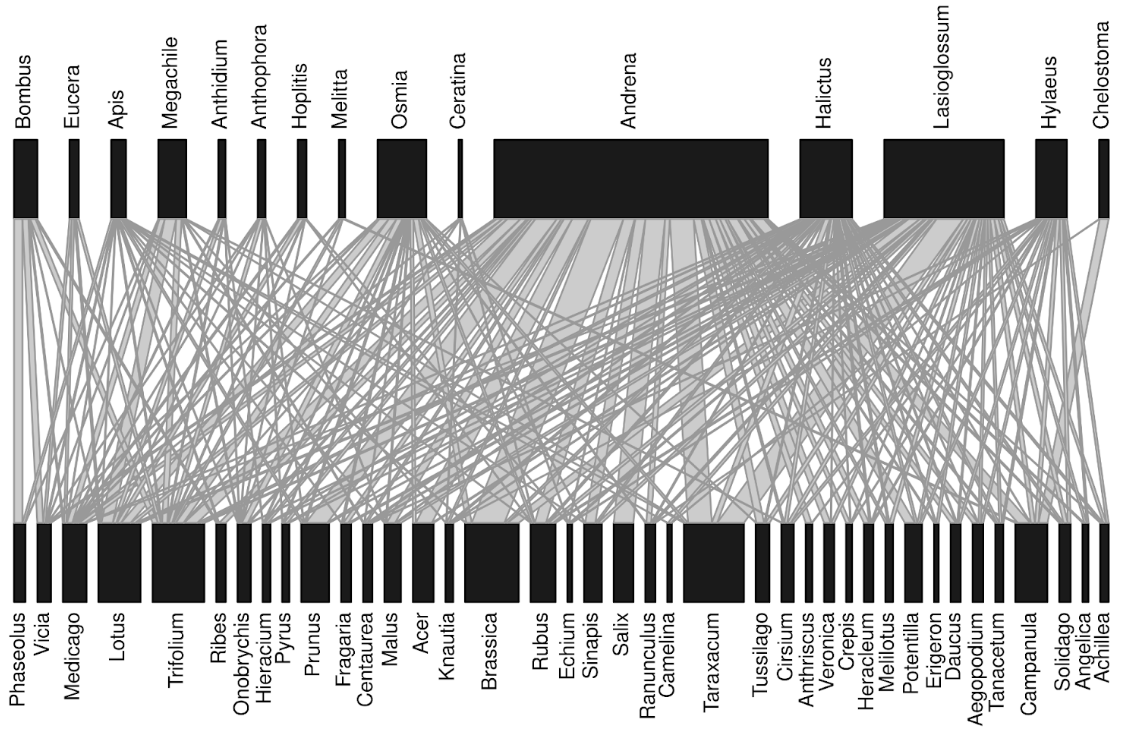
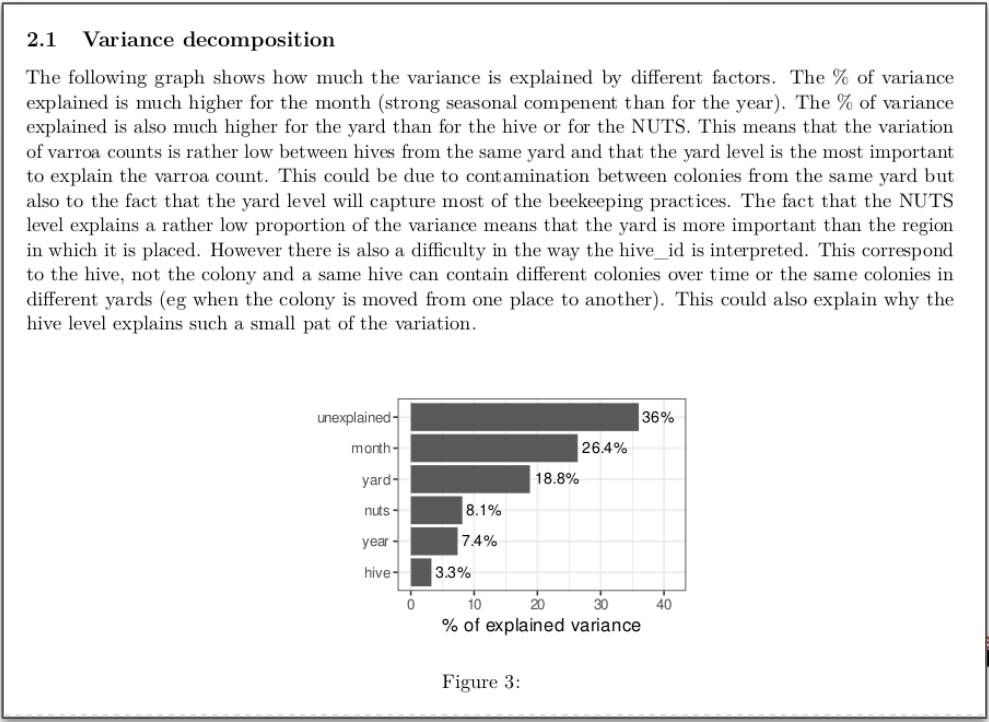
Static graphics
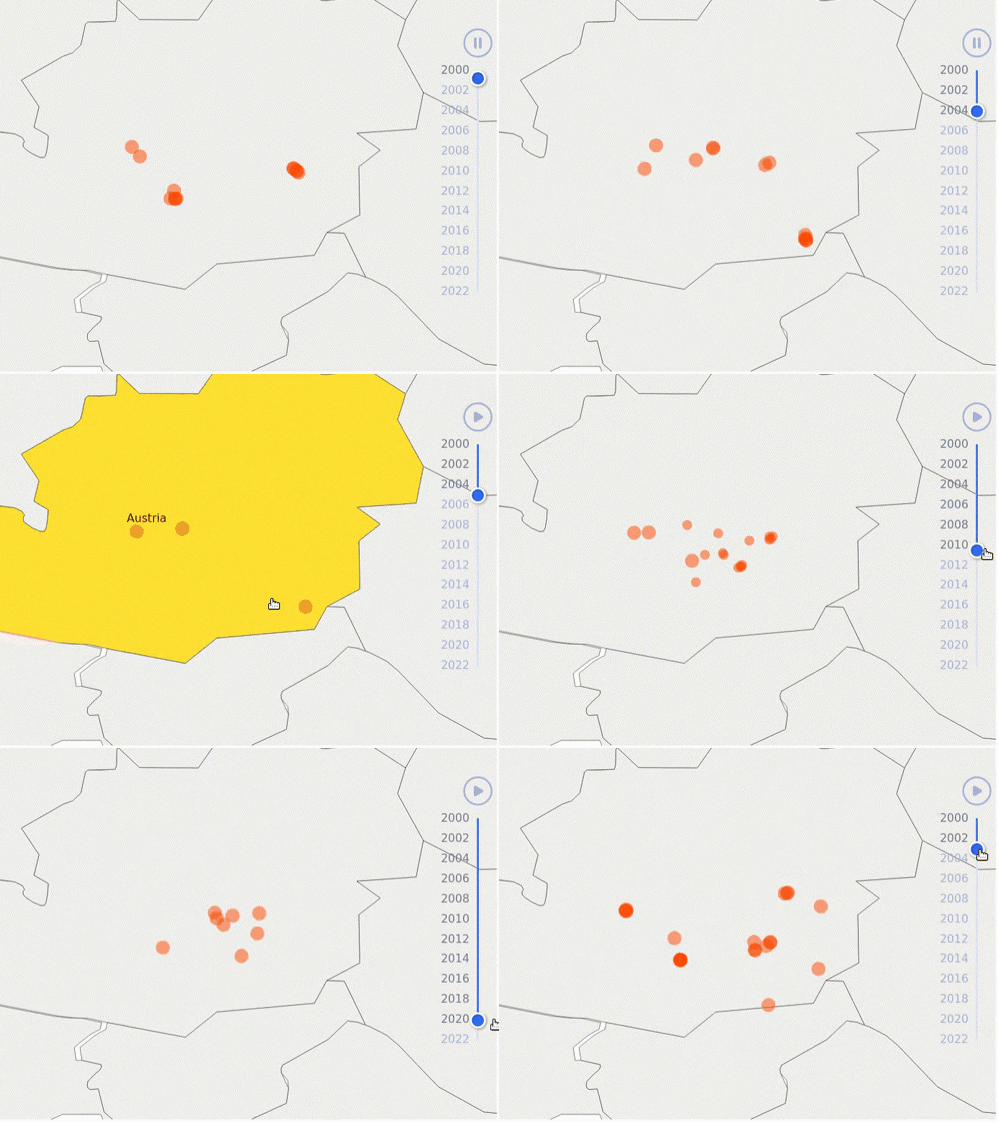
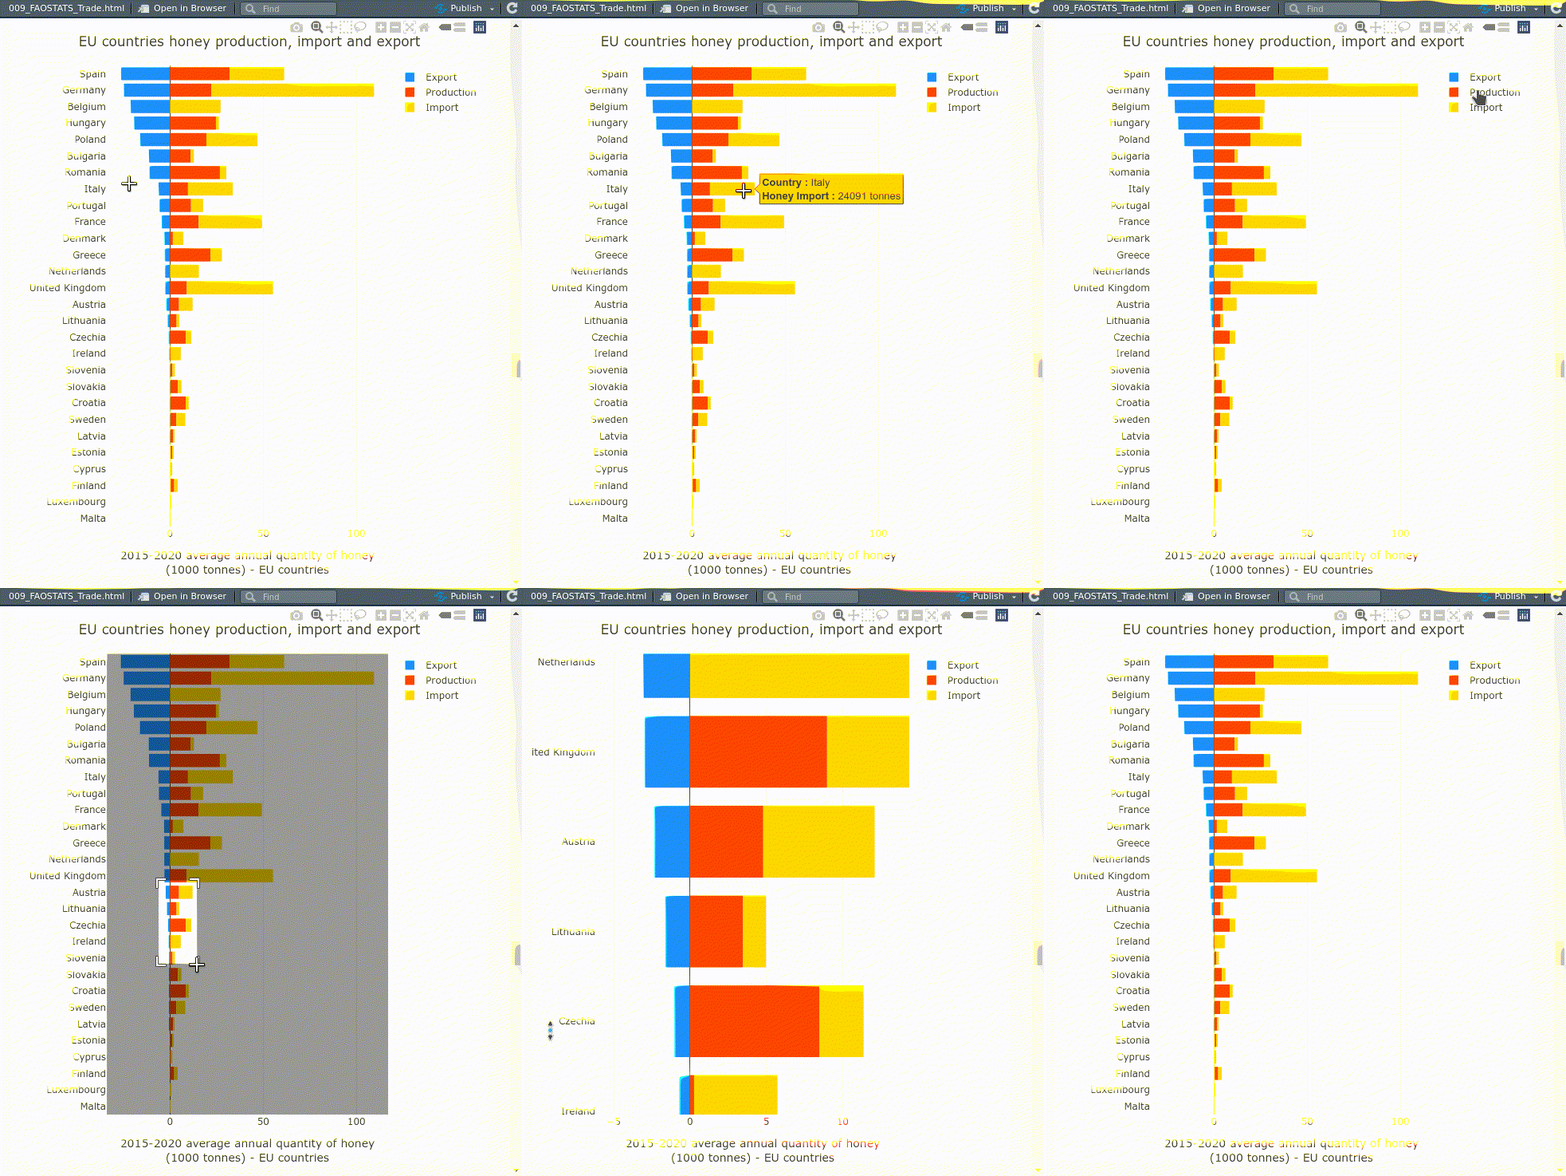
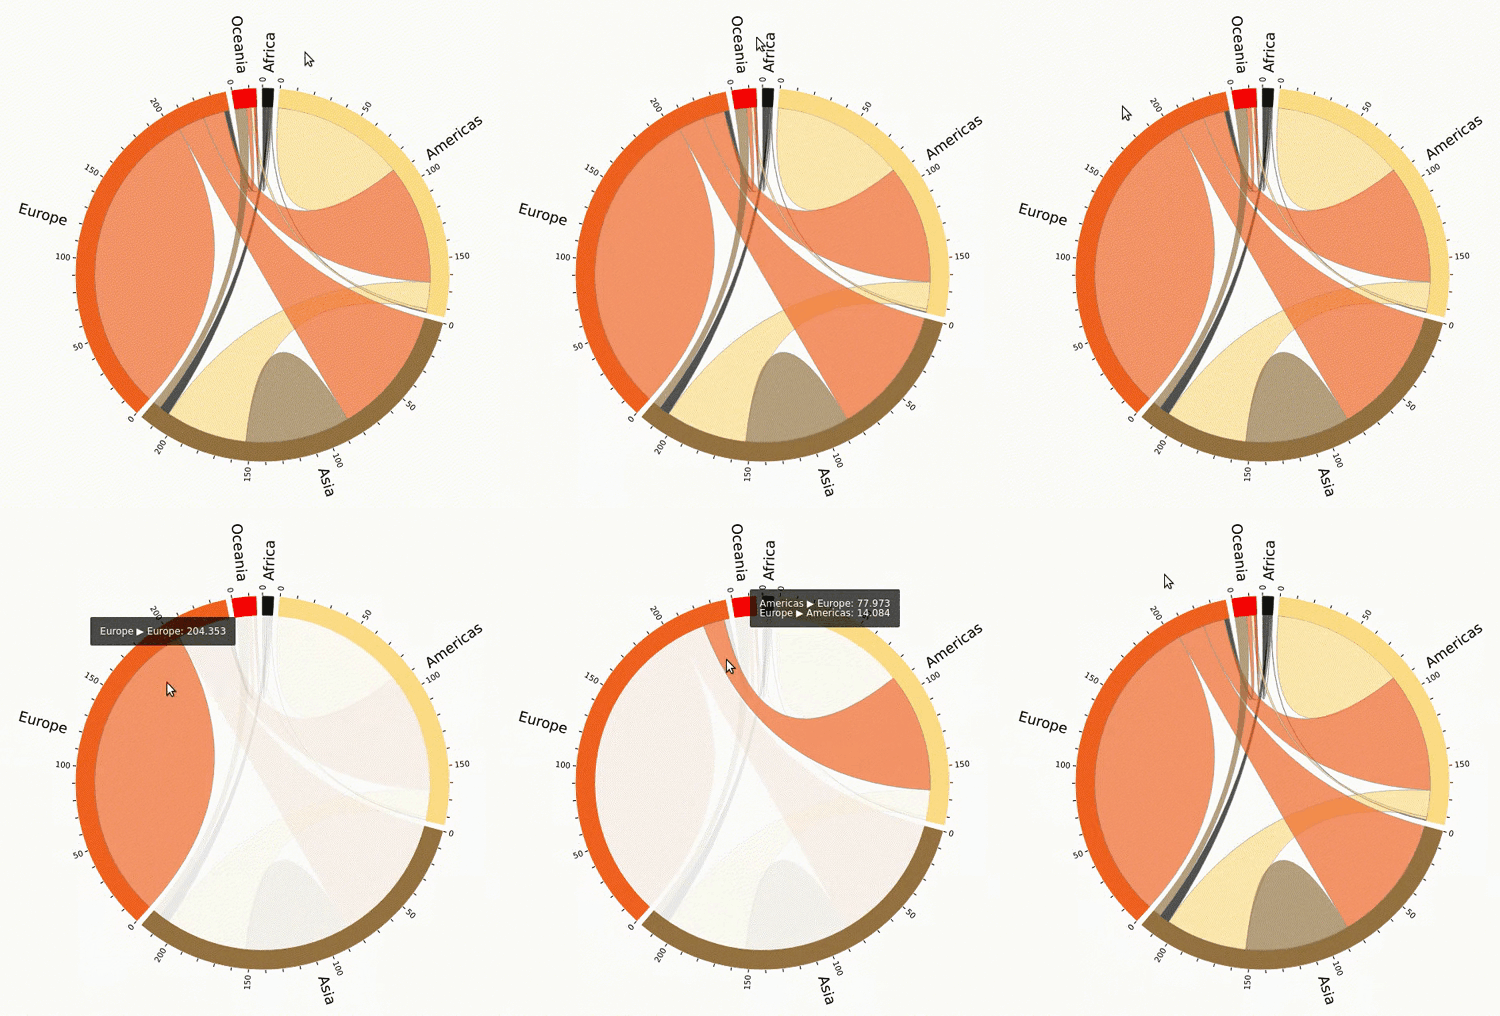
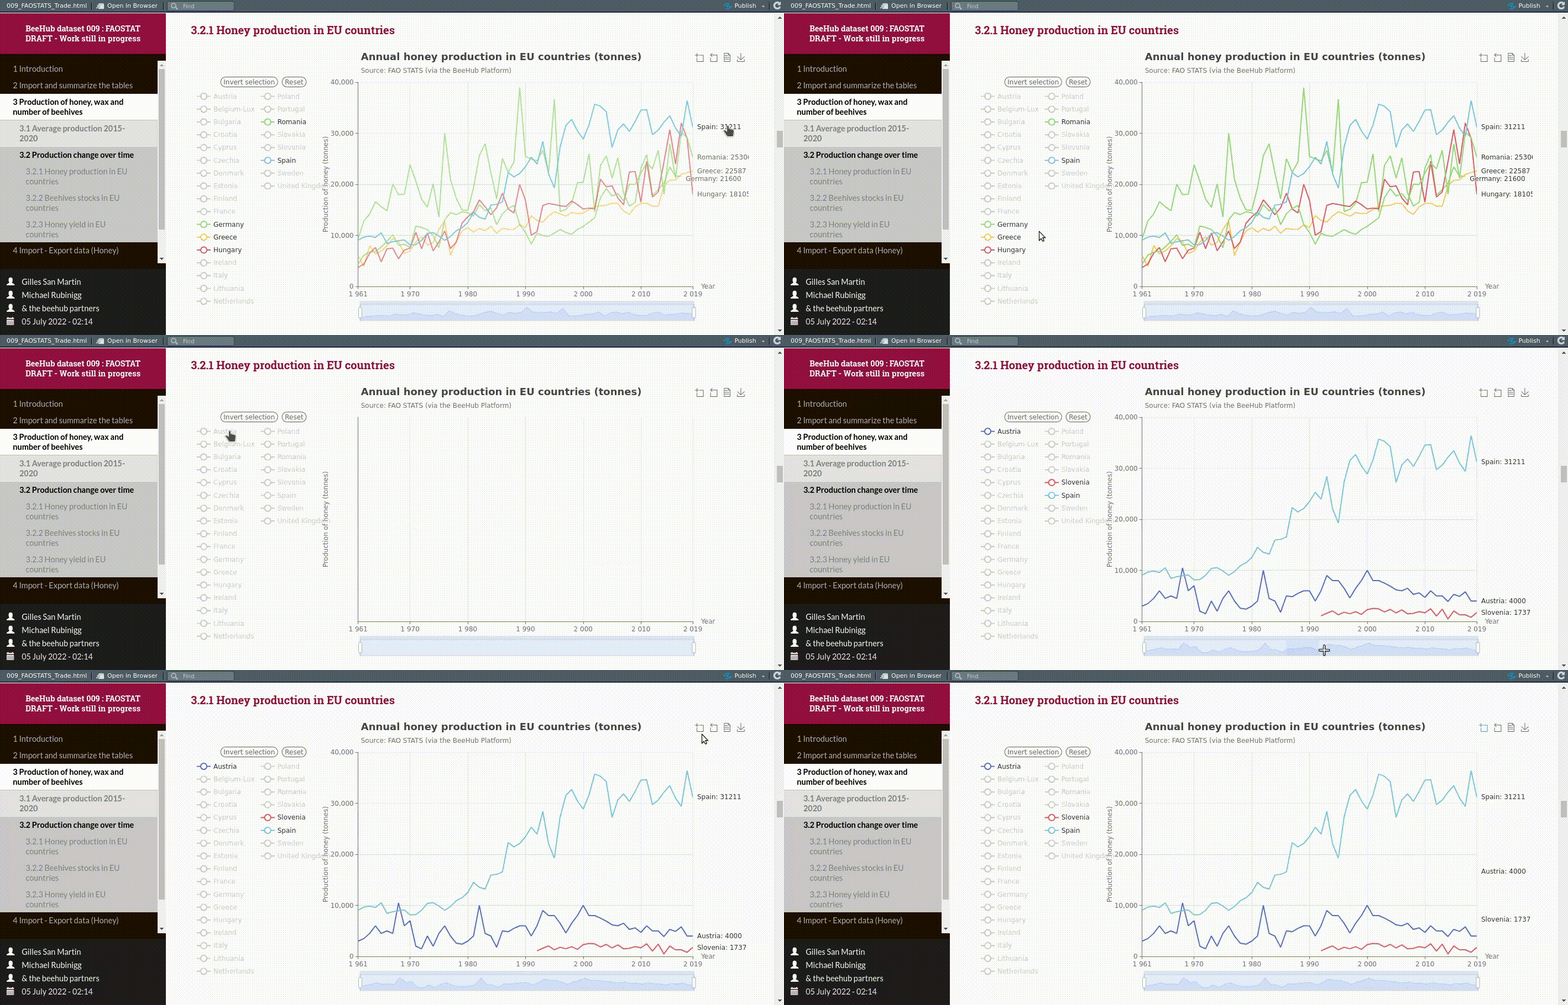
Dynamic graphics
Because sometimes historical, geographical or other trends are better shown in a dynamic format. We propose you some options to get attractive visualisation of your data.
Data Reporting
Data Providers sharing their data with the EU Pollinator Hub can also generate reports on their data. Try our reporting features and get appealing static and dynamic reports for your work and leisure time.
In non pulvinar purus curabitur nisi odio vel
